
Circuit Breakers and Price Bands on Indian Exchanges: Why Your Stock Suddenly Won’t Move
The Stock That Just… Stopped
You place a sell order. It doesn’t fill. You refresh. Still nothing. The price on your screen hasn’t moved in an hour, but there’s a queue of orders stacked up at that exact number and going nowhere.
Your first instinct is that something’s broken — your broker, the app, maybe your internet. Nothing is broken. Your stock has hit a circuit, and depending on which kind, it means something very different for what you should do next.
Most traders lump these events together as “the market froze.” In reality, there are two completely separate alarms at play, and confusing them leads to bad decisions — panicking about one stock when the whole market is fine, or ignoring a real market-wide halt because you assumed it was just your one holding.
Two Different Alarms, Often Confused
Here’s the distinction that matters most, and it’s worth locking in before anything else:
- Price bands apply to one stock at a time. They cap how far that single stock can move in a session.
- Market-wide circuit breakers apply to the entire market at once. They’re triggered by the Nifty 50 or Sensex, not by any individual stock.
One stock hitting its circuit says nothing about the rest of the market. The market halting says nothing about any single stock’s individual band. They’re related concepts — both exist to slow down panic — but they operate on completely different triggers, at completely different scales.
Price Bands — A Speed Limit for One Stock
Every stock listed on NSE and BSE gets a daily price band: a ceiling it can’t rise above, and a floor it can’t fall below, both calculated from the previous day’s closing price. Think of it as a speed limit set fresh every morning for that one stock.
Market-Wide Circuit Breakers — A Pause for Everyone
Separately, both exchanges watch the Nifty 50 and Sensex for sudden, sharp index-level moves. If the index itself swings hard enough, trading pauses across the entire market — every stock, every derivative, all at once. This has nothing to do with any single company’s news or price band.
Keep these two ideas separate in your head, and everything else in this article will make a lot more sense.
How Upper and Lower Circuits Actually Work
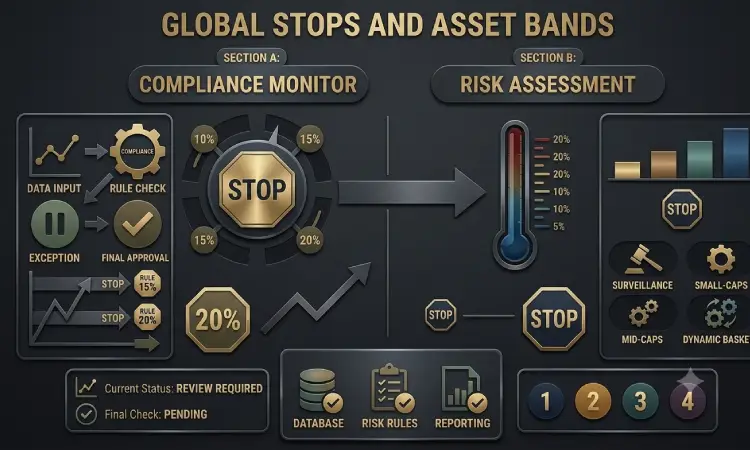
A stock’s price band is typically set at 2%, 5%, 10%, or 20% of the previous close, depending on the stock’s size, liquidity, volatility, and how closely the exchange is watching it under its surveillance framework.
What an Upper Circuit Looks Like in the Order Book
When buying pressure pushes a stock to the top of its band, it hits the upper circuit. The price freezes at that ceiling for the rest of the session. Buy orders keep piling up, but sellers effectively vanish — nobody’s willing to sell at a price about to go higher, so the order book fills with buyers and almost nothing else.
If you already hold the stock, this looks great on paper. If you’re trying to buy in, you’re stuck watching from outside.
What a Lower Circuit Looks Like (and Why It’s Scarier)
The lower circuit is the mirror image. Selling pressure drags the price to the floor of its band, it locks there, and buyers disappear. Sell orders stack up with no one on the other side.
This one deserves more caution than the upper circuit. If a stock gets stuck at its lower circuit for several sessions in a row, each day’s floor resets lower against the previous close — meaning a stock can keep sliding day after day with no way for existing holders to exit. That’s the scenario every trader dreads: wanting out and having no buyer willing to take the other side.
Why Some Stocks Get a 2% Band and Others Get 20%
Bands aren’t random. As a general pattern:
- Large, actively traded, well-established stocks tend to get tighter bands — 2% to 5%
- Smaller, thinly traded, or historically volatile stocks tend to get wider bands — 10% to 20%
- Stocks under heightened surveillance for unusual price activity often get squeezed into the tightest 2% band, specifically to slow down speculative moves
The exchange reviews and adjusts these categories periodically, so a stock’s band today isn’t guaranteed to be the same next quarter.
The Exception: F&O Stocks Don’t Freeze the Same Way
Here’s a detail that trips up a lot of beginners: stocks that also trade in the futures and options segment don’t have a fixed daily price band the way other stocks do.
Instead, they operate under a dynamic price band — typically around 10% on either side of the current market price — that can flex during the day if the stock moves sharply, rather than locking hard at one number. As the price approaches the edge of that dynamic band, the limits get relaxed further to keep trading possible, usually with a short cooling-off period before new limits kick in.
This is exactly why you’ll rarely see a heavily traded large-cap stock hit a clean, hard-locked circuit the way a thinly traded small-cap does. The mechanism protects against runaway moves without freezing one of the market’s most actively traded names completely.
When the Whole Market Pauses: Index-Level Circuit Breakers
Market-wide circuit breakers exist for genuine, broad-based panic — not for one stock’s bad news, but for the kind of move that threatens the entire market at once.
They’re triggered off the Nifty 50 or Sensex, at three escalating levels:
- 10% move: Trading halts for a fixed period
- 15% move: Another halt, longer than the first
- 20% move: Trading is suspended for the remainder of the day
When any of these levels trigger, every equity and derivative market pauses simultaneously — not just the sector or stock that started the move. Markets typically resume with a fresh pre-opening session once the halt period ends.
This isn’t a hypothetical. On 13 March 2020, the Nifty 50 dropped 10% during early trading, halting both NSE and BSE for 45 minutes. That’s the scale of event this mechanism is built for — genuinely rare, and genuinely different from your one stock hitting its daily band.
Why This Matters for How You Trade
Once you know which alarm you’re actually looking at, a few practical things follow:
- Pending orders don’t cancel automatically. If your buy or sell order is sitting at the circuit price when the freeze hits, it stays in the queue — it doesn’t vanish, and it doesn’t execute either, unless a matching order shows up.
- Circuits protect you, but they can also trap you. A lower circuit stops a crash from getting worse in one session, but it also means you may not be able to exit until buyers return — sometimes across several sessions.
- Repeated circuit hits invite extra scrutiny. Stocks that hit their band again and again tend to get pulled into stricter surveillance, which usually means a tighter band and higher margin requirements going forward — reducing exit liquidity even further.
- A market-wide halt affects your whole portfolio, not one position. If you’re trading intraday when one triggers, understand that every open position is frozen at once, and margin requirements can shift sharply once trading resumes.
None of this is something you want to be figuring out for the first time while your own money is stuck in a locked stock. Knowing the difference between a stock’s own price band and a market-wide circuit breaker — before you’re staring at a frozen order book — is exactly the kind of practical market knowledge that separates informed traders from confused ones. If you’d rather build this understanding properly instead of learning it the hard way, Upside’s share market classes in Mumbai cover these mechanics in depth, alongside the trading and investing skills that put them to use.
The Real Takeaway
A circuit isn’t a glitch — it’s a designed pause. Price bands stop one stock’s panic from spiraling within a session. Market-wide circuit breakers stop the whole market’s panic from compounding across the board. They’re built for different scales of the same problem: giving buyers and sellers a moment to reconsider before things run away completely.
Next time your order just sits there, you’ll know exactly which alarm you’re looking at — and what it actually means for you.
Frequently Asked Questions
What is the difference between an upper circuit and a lower circuit? An upper circuit is the highest price a stock can reach in a session — buyers are present but sellers disappear. A lower circuit is the lowest price it can fall to — sellers are present but buyers disappear. Both are calculated as a percentage of the previous day’s closing price.
What is the difference between a price band and a market-wide circuit breaker? A price band applies to one stock and limits how far it can move that day. A market-wide circuit breaker applies to the entire market and is triggered by a sharp move in the Nifty 50 or Sensex, halting all trading at once.
Do my pending orders get cancelled when a stock hits its circuit? No. Orders sitting at the circuit price remain in the order book. They aren’t cancelled, but they also won’t execute unless a matching buyer or seller appears.
Why do some stocks have a 20% price band and others only 2%? Bands are based on a stock’s size, liquidity, volatility, and surveillance status. Large, stable, actively traded stocks usually get tighter bands, while smaller or more volatile stocks get wider ones.
Do F&O stocks have upper and lower circuits like other stocks? Not in the same fixed way. Stocks in the futures and options segment operate under a dynamic price band that can adjust during the day, rather than a hard daily limit — which is why they rarely show a clean, locked circuit.
How do I check a stock’s circuit limit for the day? You can look up any stock on the NSE or BSE website directly, where the current day’s upper and lower circuit prices are listed alongside other trading data.