Equity, Debt and Derivatives: Understanding the Three Pillars of Indian Markets

Equity, Debt and Derivatives: Understanding the Three Pillars of Indian Markets

The Indian financial market is divided into three core segments — equity (ownership in companies), debt (fixed-income instruments like bonds), and derivatives (contracts based on the value of underlying assets). Each segment serves a different purpose, carries a different level of risk, and attracts a different type of investor or trader. When most people think […]

Read More
NSE vs BSE: What’s the Difference and Which One Should You Use?

NSE vs BSE: What’s the Difference and Which One Should You Use?

NSE (National Stock Exchange) and BSE (Bombay Stock Exchange) are India’s two primary stock exchanges. NSE is preferred for trading due to higher liquidity and dominance in derivatives, while BSE is Asia’s oldest exchange and is preferred for long-term investing and SME stocks. Most stocks are listed on both, and retail investors can access both […]

Read More
Career in Stock Market After Graduation

Career in Stock Market After Graduation: Complete Guide for 2026

Introduction India’s financial markets are growing at a pace that was unimaginable a decade ago. With over 16 crore registered demat accounts as of 2026 and daily trading volumes on BSE and NSE routinely crossing ₹50,000 crore, the demand for skilled professionals in the stock market has never been higher. If you have just completed […]

Read More
Fibonacci Retracement Explained: How to Use Fibonacci Levels

Fibonacci Retracement Explained: How to Use Fibonacci Levels

Introduction Every trader searches for the “perfect” entry, but markets rarely move in a straight line. They breathe—they push forward and then pull back. This is where Fibonacci Retracement comes into play. Whether you are performing intraday trading or swing trading, understanding these levels can significantly improve your precision and risk-reward ratio. What is Fibonacci […]

Read More
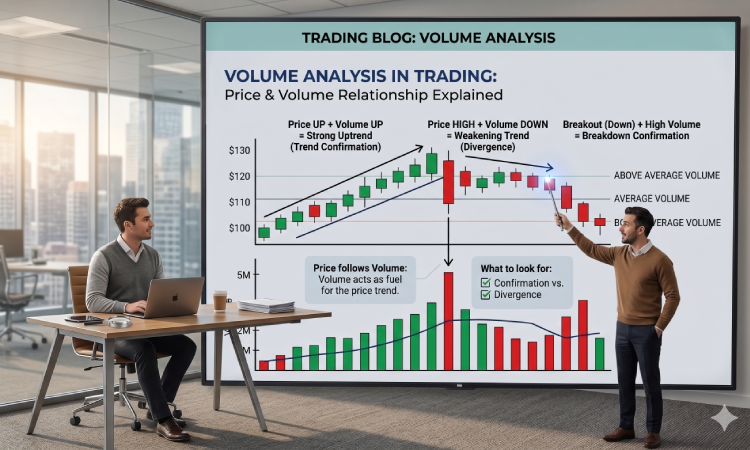
Volume Analysis in Trading: Price & Volume Relationship Explained

Volume Analysis in Trading: Price & Volume Relationship Explained

Introduction Many traders focus entirely on price movements while ignoring one of the most critical factors: Volume. The price-volume relationship acts as the “truth serum” of the market; it reveals whether a move is backed by real money or is simply a “fakeout.” By learning how to read volume in the stock market, you can […]

Read More
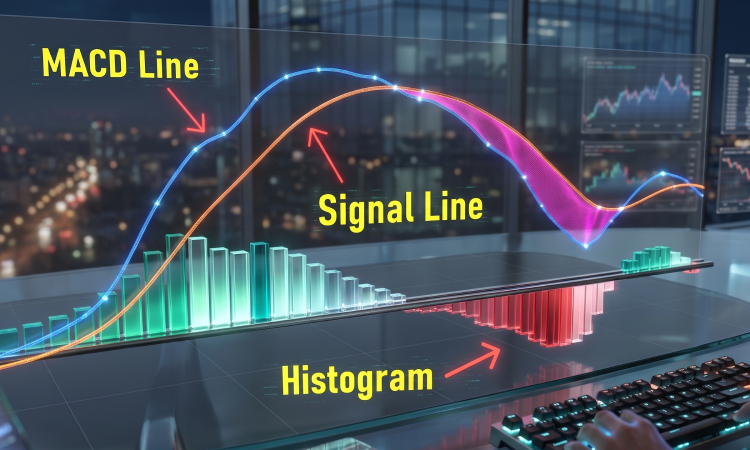
MACD Indicator Explained

MACD Indicator Explained: Best MACD Crossover Strategy for Traders

Introduction In today’s stock market, technical indicators have become an essential part of trading. Among these, MACD trading has gained massive popularity because it combines two critical elements: trend and momentum. While many beginners use it blindly, understanding how to use the MACD indicator correctly is what separates consistent traders from those who chase false […]

Read More
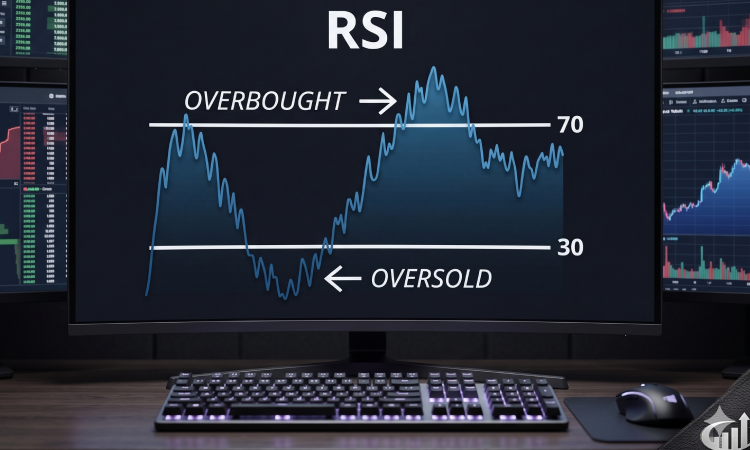
RSI Indicator Explained: How to Find Overbought & Oversold Stocks

RSI Indicator Explained: How to Find Overbought & Oversold Stocks

Introduction In today’s stock market, technical indicators have become an essential part of trading. Among them, the RSI indicator is one of the most widely used tools due to its simplicity and effectiveness. It helps traders identify “overbought” and “oversold” conditions, making it easier to spot potential reversals before they happen. Whether you are doing […]

Read More
Algo Trading in India – Complete Guide to Algorithmic & Automated Trading

Algo Trading in India – Complete Guide to Algorithmic & Automated Trading

Introduction With the rapid rise of technology in the stock market, trading has evolved from traditional manual methods to advanced automated systems. Today, traders in India are increasingly shifting towards automation to improve speed, accuracy, and efficiency. This shift has led to a massive surge in algo trading, especially among those who want to remove […]

Read More