RSI Indicator Explained: How to Find Overbought & Oversold Stocks
Introduction
In today’s stock market, technical indicators have become an essential part of trading. Among them, the RSI indicator is one of the most widely used tools due to its simplicity and effectiveness. It helps traders identify “overbought” and “oversold” conditions, making it easier to spot potential reversals before they happen.
Whether you are doing intraday trading or swing trading, understanding how to use the RSI indicator correctly is crucial for better trade timing.
What is the RSI Indicator?
The Relative Strength Index (RSI) is a momentum indicator that measures the speed and change of price movements. Developed by J. Welles Wilder, it operates on a scale of 0 to 100.
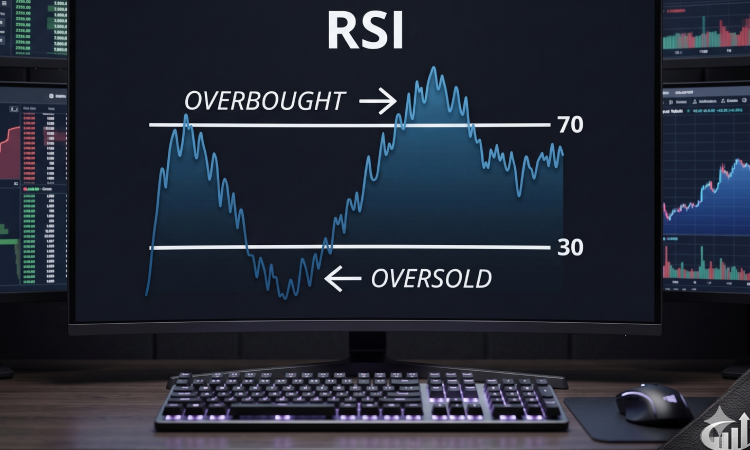
- RSI > 70: The stock is considered “Overbought” (potentially overvalued/due for a pullback).
- RSI < 30: The stock is considered “Oversold” (potentially undervalued/due for a bounce).
How RSI Works in the Indian Market
The RSI works effectively on the National Stock Exchange (NSE) because price momentum often reflects institutional participation. When the RSI moves above 70, it signals that the recent price move has been very aggressive, and profit booking might be near. Conversely, an RSI below 30 suggests that selling pressure has been extreme, often attracting bargain hunters.
RSI Trading Strategies
To get the best results, don’t just trade the numbers. Use these proven methods:
- Overbought/Oversold Reversals: Look for price turning points when the RSI hits the extreme 70/30 zones.
- RSI Divergence: This is a powerful setup where the price makes a new high, but the RSI makes a lower high. This often signals a trend reversal is coming.
- Support & Resistance Combo: RSI works best when you combine it with support and resistance levels. An RSI bounce at a major support zone is a high-probability setup.
Limitations: Why You Shouldn’t Trade RSI Alone
Many beginners fall into the trap of “blind trading.” Here is why RSI needs caution:
- False Signals: In a very strong “bull market,” a stock can stay “overbought” (RSI above 70) for weeks while the price keeps climbing.
- Trend Dependence: Always check the overall trend. Trading against a strong trend just because RSI is “overbought” is a common way to avoiding common trading failures.
- Confirmation Needed: Never use RSI in isolation. Always confirm with price action.
Build Your Foundation with Upside Stock Market Institute
Learning to read the RSI is just one piece of the puzzle. At Upside, we teach you how to integrate momentum tools into a holistic trading plan.
- Structured Learning: Move from basic candlestick formations to advanced strategy building.
- Practical Mentorship: Learn to filter “noise” and identify high-quality RSI setups.
- Flexible Options: Join our share market classes in Mumbai or access our high-quality online training modules.
- The Full Roadmap: Our Advance Diploma in Stock Market ensures you understand not just what to use, but when to use it.
Conclusion
The RSI indicator is a simple yet powerful tool to measure market energy. While it is beginner-friendly, it delivers the best results when combined with other technical tools and a disciplined risk management strategy. Like any trading skill, consistency comes from practice and proper guidance.
Frequently Asked Questions (FAQs)
1. Is RSI good for intraday trading? Yes, it is excellent for intraday trading as it helps identify short-term momentum spikes.
2. Can I use RSI for long-term investing? Yes, it helps identify attractive entry points when a quality stock is “oversold” on a weekly or monthly chart.
3. What is the best setting for RSI? The standard setting is 14 periods, which works effectively for most stocks in the Indian market.
4. Where can I learn to trade using technical indicators in Mumbai? Upside Stock Market Institute offers specialized courses that focus on practical, indicator-based trading strategies.