
Moving Average Explained: SMA vs EMA and How to Use the 20, 50 and 200 DMA
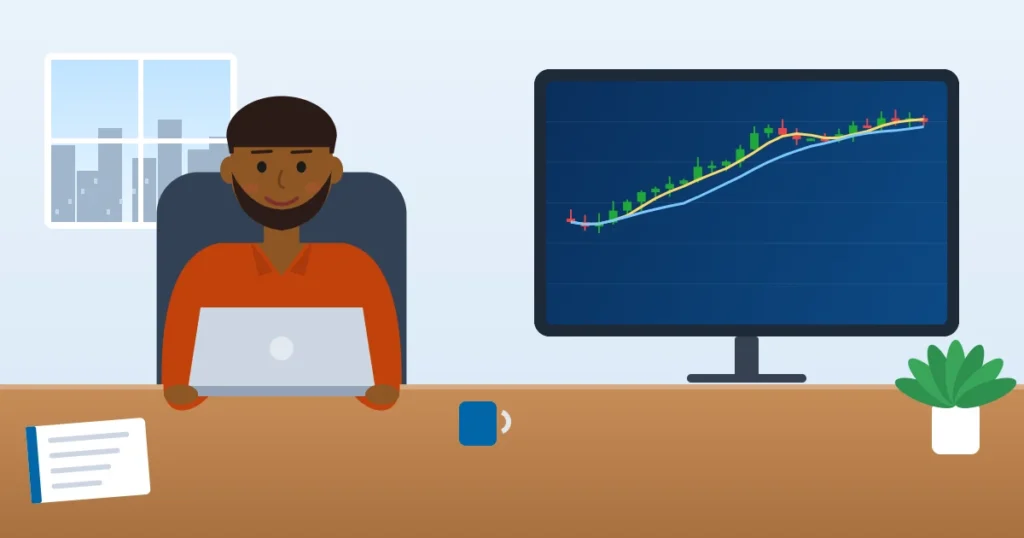
The moving average is the first indicator most traders add to a chart, and for good reason. It turns noisy daily prices into one smooth line that shows the trend at a glance.
This guide explains what a moving average is, the difference between SMA and EMA, how to calculate both, and five practical ways Indian traders use the 20, 50 and 200-day moving averages.
What Is a Moving Average?
A moving average is the average closing price of a stock over a set number of periods, recalculated every new period. Because the oldest price drops off and the newest is added, the average “moves” with the chart.
On a daily chart, a 50-day moving average (often called the 50 DMA) is the average of the last 50 closing prices. For a quick definition, see our moving average FAQ.
Simple Moving Average (SMA)
The SMA gives equal weight to every price in the period.
Example (5-day SMA): closing prices of ₹100, ₹102, ₹101, ₹104 and ₹108.
SMA = (100 + 102 + 101 + 104 + 108) ÷ 5 = ₹103.
Tomorrow, if the stock closes at ₹110, the ₹100 drops off: (102 + 101 + 104 + 108 + 110) ÷ 5 = ₹105.
Exponential Moving Average (EMA)
The EMA gives more weight to recent prices, so it reacts faster.
EMA today = (Price today × k) + (EMA yesterday × (1 − k)), where k = 2 ÷ (N + 1).
For a 10-day EMA, k = 2 ÷ 11 ≈ 0.18, so today’s price carries about 18% of the weight. Your charting platform does this maths for you; the point is to know why the EMA turns sooner.
SMA vs EMA: Which Should You Use?
| SMA | EMA | |
|---|---|---|
| Weighting | Equal for all prices | More weight on recent prices |
| Speed | Slower, smoother | Faster, more responsive |
| False signals | Fewer | More |
| Best for | Long-term trend (50, 200) | Short-term trading (9, 20, 21) |
| Common users | Investors, positional traders | Intraday and swing traders |
There is no “better” one. Many traders use EMA for entries and SMA for the bigger trend.
The Popular Moving Averages and What They Mean
| Moving average | Timeframe it reflects | Typical use |
|---|---|---|
| 9 / 20 EMA | Short term (2–4 weeks) | Intraday and swing entries |
| 50 DMA | Medium term (~2.5 months) | Swing and positional trend |
| 100 DMA | Medium-long term | Pullback support in strong trends |
| 200 DMA | Long term (~10 months) | Bull vs bear market filter |
5 Ways Traders Use Moving Averages
- Trend direction. Price above a rising 50 DMA suggests an uptrend; below a falling one suggests a downtrend. This is the core of any trend-following strategy.
- Dynamic support and resistance. In strong trends, price often pulls back to the 20 EMA or 50 DMA and bounces. Compare with fixed support and resistance levels.
- Crossovers. A short MA crossing above a long MA signals strength. The 50 DMA crossing above the 200 DMA is the famous “golden cross”; crossing below is the “death cross”.
- Trend filter. Many investors buy only stocks trading above their 200 DMA, avoiding long downtrends.
- Building other indicators. MACD and Bollinger Bands are both built from moving averages. Learn the MACD crossover strategy next.
Limitations You Must Know
- Moving averages lag. They are built from past prices, so signals come after the move has started.
- Sideways markets create whipsaws. Price crosses the average back and forth, giving false signals.
- No single setting works everywhere. Test what suits your stock and timeframe.
Combine moving averages with volume and a momentum indicator like RSI to filter weak signals.
A Simple Moving Average Checklist
Frequently Asked Questions
What is a moving average in the stock market? It is the average closing price over a set number of periods, updated each period, used to show the trend.
Which moving average is best for intraday trading? Short EMAs like the 9 and 20 EMA on 5- or 15-minute charts are popular because they react quickly.
What does the 200-day moving average mean? It reflects the long-term trend. Price above a rising 200 DMA is widely seen as a long-term uptrend.
What is a golden cross? When the 50-day moving average crosses above the 200-day moving average, signalling possible long-term strength.
Is EMA better than SMA? EMA is faster and SMA is smoother. The right choice depends on your trading style.
Conclusion
Moving averages help you read the trend, find pullback zones and filter trades. They lag, so pair them with price action, volume and risk rules. Our Technical Analysis course teaches moving averages, MACD, RSI and price action on live charts over 1.5 months in Dadar and Thane. New to charts? Start with why technical analysis matters. Want to see how we teach? Book a free demo class at our Dadar or Thane branch, or call +91 99304 40999.
Disclaimer: This article is for education only and is not investment advice.