MACD Indicator Explained: Best MACD Crossover Strategy for Traders
Introduction
In today’s stock market, technical indicators have become an essential part of trading. Among these, MACD trading has gained massive popularity because it combines two critical elements: trend and momentum.
While many beginners use it blindly, understanding how to use the MACD indicator correctly is what separates consistent traders from those who chase false signals. In this blog, we will explore the best MACD strategies and how to apply them effectively in real market conditions.
What is the MACD Indicator?
The Moving Average Convergence Divergence (MACD) indicator was developed by Gerald Appel. It is designed to reveal changes in the strength, direction, momentum, and duration of a trend in a stock’s price.
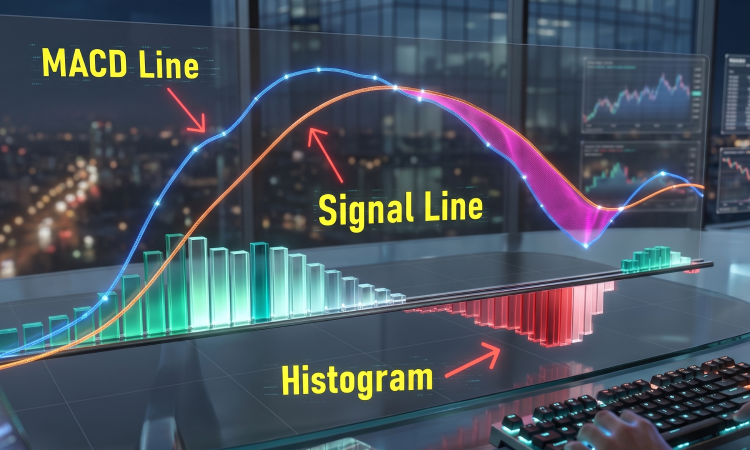
The MACD consists of three key parts:
- MACD Line: The difference between two exponential moving averages (EMA).
- Signal Line: An EMA of the MACD line, used to trigger signals.
- Histogram: Visualizes the gap between the MACD line and the Signal line.
How the MACD Strategy Works
The core of MACD trading relies on the “crossover”:
- Bullish Crossover: When the MACD line crosses above the signal line, it suggests that upward momentum is building—a potential buy signal.
- Bearish Crossover: When the MACD line crosses below the signal line, it suggests downward momentum is accelerating—a potential sell signal.
MACD in the Indian Stock Market
On the National Stock Exchange (NSE), the MACD strategy is highly effective because Indian stocks often trend for extended periods. Both intraday trading and swing trading enthusiasts use MACD to confirm the strength of a move. When the histogram expands, it shows that the trend is gaining speed, which is a key confirmation for professional traders.
Best MACD Strategies for NSE
- The Crossover Setup: Don’t trade every cross. Only trade the crossover if it happens in the direction of the long-term trend (e.g., look for bullish crossovers when the stock is overall in an uptrend).
- MACD & Support/Resistance: Never trade a crossover in the middle of “nowhere.” Wait for the MACD crossover to occur at a major support or resistance zone.
- Avoid Sideways Markets: In a “choppy” or sideways market, MACD will give you “whipsaws” (multiple false crosses). Learn to identify market phases to avoid common trading failures.
Learn Professional MACD Trading with Upside
MACD is a lagging indicator, meaning it follows the price. The real skill lies in learning how to combine it with leading indicators like price action.
At Upside Stock Market Institute, we don’t just teach you what the buttons do; we teach you the logic behind the market:
- Practical Mentorship: Learn to filter signals using Smart Money Concepts.
- Hands-on Practice: Apply MACD strategies during live market hours.
- Structured Roadmap: Join our Advance Diploma in Stock Market to master the full toolkit.
- Flexible Learning: Visit our share market classes in Mumbai or access our expert-led online training.
Conclusion
MACD is a powerful trend-based tool, but it is not a “magic button.” It works best when used as a confirmation tool rather than a standalone decision-maker. Combine it with your trend analysis, keep your risk management tight, and you will see a significant improvement in your trading performance.
Frequently Asked Questions (FAQs)
1. Is MACD better than RSI? MACD is better for confirming trend direction, while RSI is better for identifying overbought/oversold exhaustion zones. Most pros use both.
2. Can beginners use MACD for intraday trading? Yes, but ensure you are using it on the right timeframes (like 15m or 30m) rather than very short ones (1m).
3. Why do I get false signals with MACD? False signals usually happen in sideways markets. Always check if the stock is trending before relying on MACD crossovers.
4. Where can I find expert guidance on MACD strategies in Mumbai? Upside Stock Market Institute provides practical training that focuses on indicator-based strategy building for the Indian markets.