Two Candlestick Patterns Explained for Beginners: Trade with More Confidence

After understanding single candlestick patterns, many traders still struggle with “market noise” and false signals. You might see a Hammer and enter a trade, only to see the market continue its downtrend. This is where Two Candlestick Patterns (also known as Double Candlestick Patterns) become essential.
By combining two consecutive sessions, these patterns provide a more reliable narrative of market behavior. They show you exactly how sentiment shifts from one day to the next, helping you identify reversals and continuations with much higher accuracy.
What is a Two Candlestick Pattern?
A two candlestick pattern is formed by two consecutive candles that, when viewed together, tell a story of a power shift. While a single candle shows a snapshot, a double pattern shows a momentum change. This reduces the chances of falling into the common trading mistakes beginners make, such as entering a trade prematurely.
Bullish Two Candlestick Patterns (Buying Signals)
These patterns signal that the bearish momentum is exhausted and the “Bulls” are ready to take over.
1. Bullish Engulfing
This is one of the most powerful reversal signals in technical analysis.
- Structure: A small red (bearish) candle is followed by a much larger green (bullish) candle that completely “swallows” or engulfs the body of the first.
- Psychology: In the first session, sellers were in control. In the second, buyers didn’t just step in—they overwhelmed the sellers entirely, closing the price above the previous day’s open.
2. Piercing Pattern
A slightly more subtle version of the engulfing pattern.
- Structure: A long red candle is followed by a green candle that opens with a “gap down” (below the first candle’s low) but closes above the 50% midpoint of the red candle.
- Psychology: Even though the market opened lower (showing fear), buyers fought back to recover more than half of the previous day’s losses. This shows significant buying interest at lower levels.
3. Tweezer Bottom
- Structure: Two candles (the first red, the second green) that have the exact same “low” price.
- Psychology: Sellers tried to break a price level twice and failed both times. This “double rejection” at the same price creates a solid floor, signaling a potential moon-shot.
Bearish Two Candlestick Patterns (Selling Signals)
These appear after an uptrend and warn you that the “Bears” are starting to dominate the price action.
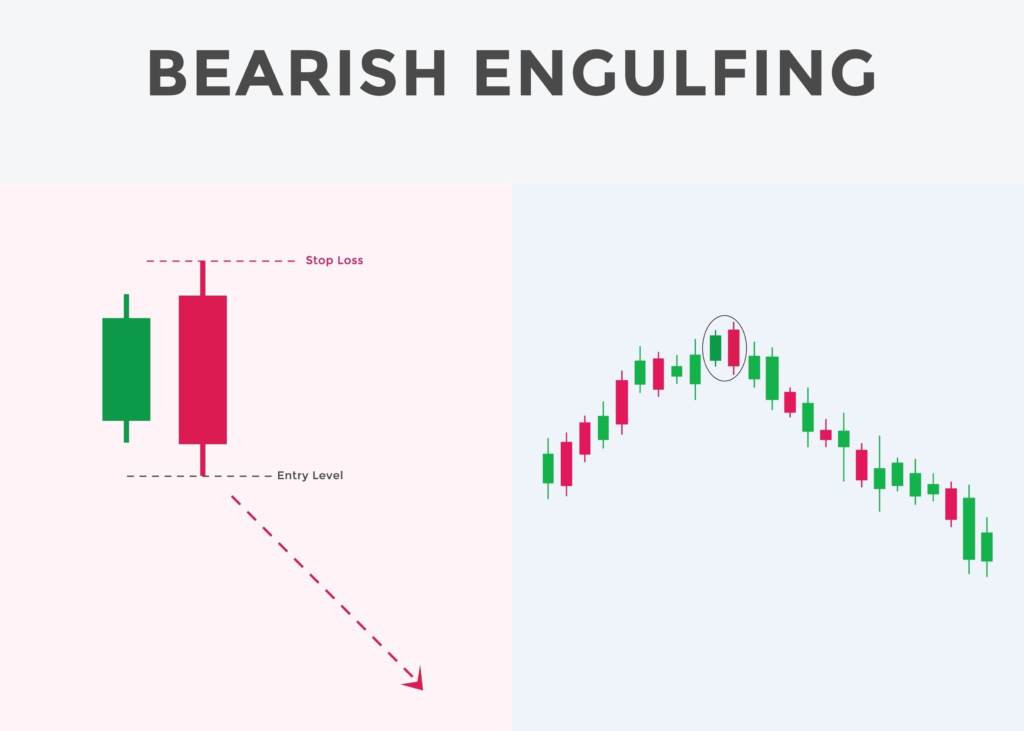
1. Bearish Engulfing
- Structure: A small green candle is engulfed by a massive red candle.
- Psychology: Buyers were comfortably pushing the price up until a sudden wave of selling pressure wiped out all the gains from the previous session. It signifies a total loss of confidence among buyers.

2. Dark Cloud Cover
The bearish counterpart to the Piercing Pattern.
- Structure: A strong green candle is followed by a red candle that opens with a “gap up” but closes deeply into the body of the green candle (below the 50% mark).
- Psychology: The “gap up” trapped optimistic buyers. When the price reversed and closed low, those buyers were forced to exit, fueling a further move down.
3. Tweezer Top
- Structure: Two candles with nearly identical “highs” at the top of an uptrend.
- Psychology: Buyers hit a “ceiling” twice. The market is literally refusing to go any higher, which is a massive red flag for anyone holding long positions. This is a key concept we emphasize in our Advanced Diploma in Stock Market.
5 Frequently Asked Questions (FAQ)
1. Is an Engulfing pattern more reliable than a Hammer? Generally, yes. Because it uses two sessions of data, it shows a confirmed shift in power rather than just a price rejection.
2. What if the second candle doesn’t close above the 50% mark in a Piercing Pattern? If it closes below the midpoint, the pattern is weak and should be ignored. It shows that buyers didn’t have enough strength to truly challenge the sellers.
3. Does the color of the Tweezer candles matter? Ideally, the first candle should match the current trend, and the second should be the opposite color. For a Tweezer Top, the first should be green and the second red.
4. Should I trade these patterns in a sideways market? No. These are reversal patterns. They lose their predictive power in a choppy, sideways market. They work best at clear Support and Resistance levels.
5. Can I use these for Intraday trading? Absolutely. These are highly effective on 5-minute and 15-minute charts, provided you are tracking the overall market trend.
Conclusion
Mastering two candlestick patterns allows you to see the “why” behind price movements. It’s not just about shapes; it’s about understanding the shifting emotions of thousands of traders. When you combine these with fundamental analysis, you create a powerful edge over the rest of the market.
If you are ready to stop guessing and start trading with professional precision, join our Advanced Diploma in Stock Market to master multi-candle strategies.