Most Common Mistakes Traders Make While Using Candlestick Patterns
Many traders learn candlestick patterns to analyze the market but still end up with consistent losses due to misuse of these tools. Most people fail not because the patterns don’t work, but because they apply them in a vacuum. A “Hammer” in the middle of a sideways trend is just a candle; at a major support level, it is a signal.
This guide will help you identify and avoid the top 10 mistakes traders make with candlestick patterns so you can move from “guessing” to professional execution.
1. Trading Patterns Without Trend Context
One of the most frequent errors is ignoring the overall market trend. Candlestick patterns are trend-reversal or trend-continuation signals. If you try to trade a “Bullish Engulfing” pattern in a strong downtrend without any other reason, you are likely catching a falling knife. Always identify the trading vs investing trend first—is the market making higher highs or lower lows? Use the pattern only as a confirmation of that trend.
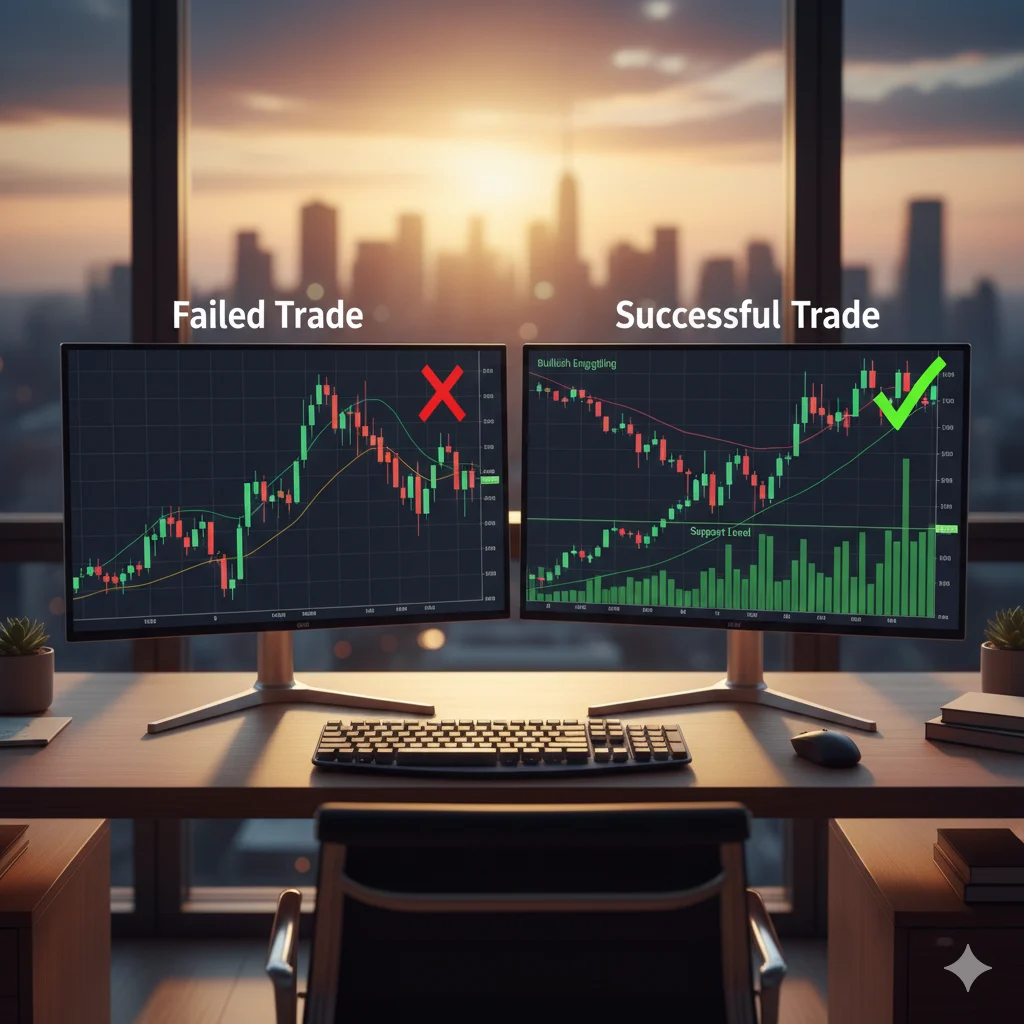
2. Ignoring Support and Resistance Levels
Candlestick patterns lose their predictive power when they form in “No Man’s Land”—the space between key price levels. The most effective patterns form near Support (Demand) or Resistance (Supply) zones. These levels represent areas where institutional buyers and sellers are waiting. Mark your levels before you look for candles.
3. Lack of Volume Confirmation
A candlestick shows price, but Volume shows the conviction behind that price. If you see a “Shooting Star” at resistance but the volume is very low, it means big players aren’t selling; it might just be a minor pullback. High volume on a reversal candle proves that the “smart money” is entering the move.
4. Trying to Trade Every Single Pattern
Beginners often suffer from “Pattern Overload.” They see a Doji and think “Reversal!” then see a Marubozu and think “Breakout!” This leads to overtrading and high brokerage costs. Professional traders focus on high-probability patterns and ignore the rest. This discipline is a core pillar of our Technical Analysis Course.
5. Entering Without a Confirmation Candle
Impatient traders enter the moment a pattern forms. However, the market often produces “false signals.” To improve accuracy, always wait for the next candle to close. If you see a Hammer, wait for the next candle to close above the Hammer’s high. This simple rule prevents you from getting trapped in common trading mistakes beginners make.
6. Ignoring the Broader Market Structure
Market structure is the “big picture”—the sequence of peaks and troughs. Even a perfect Morning Star can fail if the market structure is bearish. You must understand if the market is trending, ranging, or breaking out. Our Advanced Diploma in Stock Market teaches you how to align patterns with this structural DNA.
7. Not Using a Stop Loss
This is the most dangerous mistake. No matter how “perfect” a Three White Soldiers pattern looks, the market can reverse instantly due to news or a sudden sell-off. Trading without a stop loss is gambling. Always protect your capital by risking only a small percentage (e.g., 1-2%) of your account per trade.
8. Expecting Patterns to “Predict” the Future
Candlesticks do not have a crystal ball. They only reflect past and present sentiment. Treating a pattern as a guarantee leads to frustration. Instead, treat it as a “statistical edge.” If a pattern works 60% of the time, you need a stop loss for the 40% when it doesn’t.
9. Timeframe Disalignment
A “Bearish Engulfing” on a 5-minute chart might just be a small dip within a “Bullish Hammer” on a 1-hour chart. This confusion causes many losses. Always use Top-Down Analysis:
- Check the Daily/Hourly chart for the major trend and levels.
- Move to the 5-minute/15-minute chart for your entry based on a pattern.
10. Skipping the Practice Phase
Many beginners dive into live trading after reading one blog post. Candlestick recognition requires “chart time.” Without practice, emotions like fear and greed take over. Start with paper trading or a trading journal to track which patterns work best for your style before risking real money.
Frequently Asked Questions (FAQ)
1. Why did my Hammer candle fail to reverse the trend? A Hammer is a signal of potential reversal. If it forms in the middle of a strong bearish trend without hitting a support level or having high volume, the downward momentum will likely overpower it.
2. Which is more important: The candle shape or the volume? They are equally important. Think of the candle shape as the “Direction” and the volume as the “Fuel.” A direction without fuel won’t go far.
3. Should I use indicators with candlestick patterns? Yes. Using a confluence of tools—like an RSI (Relative Strength Index) showing “Oversold” conditions along with a Bullish Engulfing pattern—significantly increases your success rate.
4. Can candlestick patterns be used for crypto or forex? Yes. Candlestick patterns represent human psychology (fear and greed), which is the same across all financial markets including Stocks, Crypto, and Forex.
5. How many patterns should a beginner master? Don’t try to learn all 50+. Start with 3-4 high-probability patterns like the Hammer, Engulfing, and Morning/Evening Star. Master these before moving to others.
Conclusion
Candlestick patterns are like a language; if you only know the words but don’t understand the context, you will misinterpret the story. Success comes from combining these patterns with market structure, volume, and strict risk management.
To stop making these mistakes and start trading like a professional, explore our Advanced Diploma in Stock Market. We provide the hands-on practice and mentorship needed to turn these concepts into a profitable career.